

- Print this page
- This page as PDF (334KB)
Economic performance
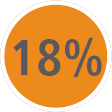
Increase in the average US dollar price received for Northam’s basket of metals.
Northam in context
Northam Platinum is currently the fifth largest platinum producer in the world. By resource base (that is the potential for production in the future) the company is the fourth largest.
By its production, Northam is considered to be a mid-tier PGM company but, unlike the other mid-tier producers and indeed any of the smaller producers, Northam is unique in that it has ownership of its production stream, from mining production to processing and marketing. Northam’s smelter at the Zondereinde complex produces final precious metal concentrate which is processed in terms of a long-term toll-refining contract with Heraeus GmbH (Heraeus). The precious metals emanating from the Heraeus refinery are shipped to Northam’s customers in Europe, Japan and North America. The by-product base metals, copper and nickel sulphate, are extracted at the on-site base metals removal plant and are sold in the domestic market.
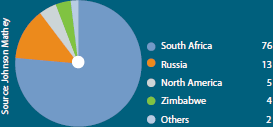
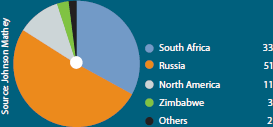
South African producers dominate global platinum production. In 2009, South African producers accounted for 4.53 million ounces of platinum and 2.76 million ounces of palladium, accounting for 76% and 33% respectively of global supply.
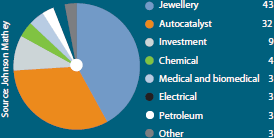
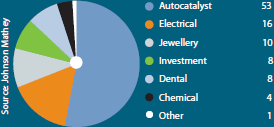
Metal prices were relatively robust in Northam’s 2010 financial year, recovering from the lows experienced in late 2008, and early 2009. Demand was sustained for both platinum and palladium, largely as a result of government incentive schemes in a number of countries which were widely successful in stimulating and maintaining sales of new vehicles. Tightening emissions legislation continued to drive autocatalyst demand, while there was also some recovery in the jewellery market especially in China, where retailers and consumers sought to take advantage of the lower prices. Exchange traded funds (ETFs) underpinned by physical platinum and palladium, are relative new demand drivers, and have had a positive impact on the market.
Northam’s sphere of influence
Northam Platinum’s Zondereinde mine and metallurgical complex is located in South Africa’s Limpopo province, at the upper reaches of the western limb of the Bushveld Complex. The large proportion of current large-scale platinum operations are located around the city of Rustenburg, some 80 kilometres from the town of Northam and the Zondereinde mine. This region is not densely populated and few formal, large-scale economic activities exist. The mining sector is an important employer in this area, with agriculture and tourism also providing jobs.
Northam’s Booysendal project is located near the town of Mashishing in Mpumalanga province. The eastern limb of the Bushveld Complex represents a significant growth area for Northam with its shallower, more accessible resource. While the region is still relatively unpopulated, there is a far greater presence of traditional land owners and dwellers, and traditional leadership structures, who represent important stakeholders to the company.
At Zondereinde, Northam provides jobs to 9 042 people (6 862 employees and 2 180 contractors). Northam also employs 13 people at the company’s corporate office in Johannesburg, which includes the Booysendal project team. At steady-state, the Booysendal project will employ in the region of 1 150 people. Through the jobs that it has created and its economic activity around its operations and in labour-sending areas, Northam’s sphere of influence is estimated to reached close to 100 000 people. (This is based on a measure of 10 individuals per single job created).
Financial performance
Northam’s Annual Report for F2010 provides extensive discussion on the operational and financial performance of the company and the material ESG issues that underpin the company’s business performance.
Key features for the year include:
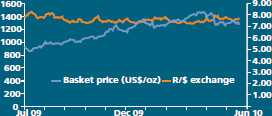
- The average US dollar price received for Northam’s basket of metals increased by 18% to US$1 185/oz but was largely negated by a decrease of 13.2% in the average rand exchange rate to R7.57 to the US dollar, resulting in an average rand price of R288 255/kg which is 2.7% higher than the previous year’s average rand price of R280 609/kg.
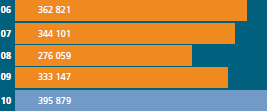
- Production units and purchased metal increased by 10% to 389 184 ounces (F2009: 318 131 ounces) with a 6.3% increase in production of metals in concentrate and a 332% increase in concentrate purchased to 2 106 kilograms (F2009: 487 kilograms). This is a reflection of the company’s strategy to build up capacity for enhanced downstream beneficiation.
- Total operating costs increased by 17% to R2 230 million from R1 906 million during F2009, driven by a 6.3% increase in volumes of production and higher mining input costs which include labour, power, chemicals and steel.
- Sales revenue increased by 23.8% year on year mainly as a result of an 18.8% increase in volumes sold.
- Operating profit was 4.0% lower at R785.0 million compared to R817.9 million the previous year.
- Group profit attributable to shareholders marginally increased by 1.7% to R641.0 million (F2009: R630 million), with headline earnings per share increasing slightly from 172.2 cents per share to 177.8 cents per share.
- The new royalty payable by mining companies from March 2010 in terms of the Mineral Resources and Petroleum Royalty Act amounting to R21 million, has been included in operating costs.
Owing to the location, the labour intensive nature of its operations and the high value of its product, Northam’s economic impact is significant in the region of its operations and not insignificant in terms of the broader economy.
Direct and indirect economic impacts include:
- The creation of 9 042 jobs, directly and indirectly, both around its operations and in areas from which Northam draws its employees.
- In F2010, some R873 million was paid to employees (including salaries and wages, contributions to retirement fund benefits, and contributions to health care funds) which is 40% of the total value distributed during the year (F2009: R733 million (36%)).
- Contributions of R26 million towards the Employee Empowerment Trust.
- Taxes paid to government at a local and national level amounted to R463 million.
No significant financial contributions were received from government.
- Shareholders received R216 million by way of dividends (F2009: R802 million).
- Corporate social investment amounted to R12.1 million (F2009: R10 million).
Value added statement
for the year ended 30 June 2010
| Notes in annual financial statements | 2010 | 2009 | ||||
|---|---|---|---|---|---|---|
| % | R 000 | % | R 000 | |||
| Sales revenue | 22 | 3 945 083 | 3 186 042 | |||
| Less: | Purchase of goods and services in order to operate mine and produce refined metal | 23 | (1 966 865) | (1 366 981) | ||
| Value added by operations | 91.3 | 1 978 218 | 90.2 | 1 819 061 | ||
| Add: | Share of earnings from associate | 25 | 0.6 | 12 440 | 3.6 | 72 606 |
| Investment income | 26 | 7.7 | 167 655 | 6.5 | 130 417 | |
| Sundry income/(expenditure) | 27 | 0.4 | 9 557 | (0.3) | (6 430) | |
| Total value added | 100.0 | 2 167 870 | 100.0 | 2 015 654 | ||
| Value distributed | ||||||
| Employees | 34 | 40.3 | 873 419 | 36.4 | 733 430 | |
| Salaries and wages | 39.8 | 861 411 | 36.0 | 725 819 | ||
| Contributions to retirement benefit funds | 3.1 | 68 211 | 3.0 | 61 042 | ||
| Contributions to health-care funds | 2.1 | 45 079 | 1.9 | 37 417 | ||
| Pay-as-you-earn deducted | (4.7) | (101 282) | (4.5) | (90 848) | ||
| Government | 21.3 | 462 829 | 24.0 | 484 088 | ||
| Mining and non-mining tax | 28 | 12.1 | 261 901 | 11.8 | 238 021 | |
| Deferred tax | 28 | 0.8 | 18 391 | 2.0 | 40 766 | |
| State's share of profits | 28 | 1.4 | 30 660 | 0.4 | 7 580 | |
| Tax on share of earnings from associate | 28 | 0.0 | 867 | 0.9 | 17 445 | |
| Secondary tax on companies | 28 | 1.0 | 21 616 | 4.0 | 80 212 | |
| Capital gains tax | 28 | 0.0 | 166 | – | – | |
| Royalties | 1.3 | 27 946 | 0.4 | 9 216 | ||
| Pay-as-you-earn deducted from employees | 4.7 | 101 282 | 4.5 | 90 848 | ||
| Providers of capital | ||||||
| Dividends | 10.0 | 216 158 | 39.8 | 802 122 | ||
| Broader community | ||||||
| Corporate social investment | 0.6 | 12 140 | 0.5 | 9 583 | ||
| Total value distributed | 72.2 | 1 564 546 | 100.7 | 2 029 223 | ||
| Retained by company | 27.8 | 603 324 | (0.7) | (13 569) | ||
| Depreciation | 24 | 7.7 | 167 346 | 8.0 | 160 907 | |
| Decommissioning provision to meet statutory obligations | 23 | 0.5 | 11 110 | (0.1) | (2 836) | |
| Retained income | 19.6 | 424 868 | (8.6) | (171 640) | ||
| 100.0 | 2 167 870 | 100.0 | 2 015 654 | |||
Black economic empowerment
Northam today is a product of the enabling legislation of the MPRDA. The company has, through a series of BEE transactions achieved compliance in respect of the BEE equity ownership of resources companies in terms of the MPRDA. Northam’s major shareholder, Mvelaphanda Resources has indicated its intention to unbundle, a process that is expected to be concluded in F2011. As a result of this corporate activity, Northam will be left with a direct BEE shareholding of 21.4%. Although this is slightly below the 26% target required by legislation, there is still a window of four years for Northam to achieve this.
In addition to this BEE shareholding at a company level, Northam in F2008 established a direct participation by the employees of the company in its economic opportunity. The Northam Employee Empowerment Trust, the Toro Trust, represents the interests of some 98% employees of the company. During F2010, Northam contributed R26 million (F2009: R15 million) to the trust in respect of the share in Northam’s profits. An initial start-up of R30 million was also paid in F2009. In F2010, the net income of the trust was R1.7 million (F2009: R1.6 million). The net interest of the beneficiaries has thus risen to R69.3 million (R46.6 million) with the first pay-outs to employees planned for 2013.
Economic transformation
Northam is mindful of the role it can and has to play in transforming its procurement base to include emerging entrepreneurs and to provide preferential access to vendors who are HDSAs. Systems to identify HDSA suppliers and to monitor and nurture expenditure with these suppliers, particularly at the operational level, are in place.
In F2010, Northam’s total procurement amounted to R1.9 billion (F2009: R1.4 billion), of which the total HDSA/BEE procurement component (with BEE equity or BEE ownership of greater than 5%) amounted to R881 million or 48% of the total (F2009: 32%).
During the year, Northam completed the process of implementing a supply chain management policy so that local BEE companies which comply with the necessary criteria are placed on the vendor list and receive preferred status in winning contracts, should they be commercially competitive. Once a year, Northam hosts an open day for suppliers so that interested parties may learn about Northam’s requirements, policies and opportunities.
In line with the requirements of the Mining Charter, Northam reports BEE/HDSA expenditure at 4.3% for capital goods, 33.7% for consumables and 10.3% for services (F2009: 5.4%, 15.2% and 14.2% respectively).
Creating local opportunity
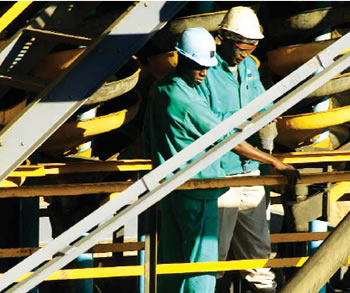
Since F2006, Northam has been engaged in an association with Northam Chrome Products (NCP), which is a 51% black-owned and managed company. This is part of Northam’s commitment to beneficiation and enterprise development.
Northam provides technical and operational support, raw material at below market rates and an operational space. Since inception, this initiative has created 26 direct permanent jobs and 20 indirect jobs.
During F2010, Northam sold chrome to the value of R5.8 million which resulted in a turnover of R122.5 million for NCP.
Beneficiation
Northam’s commitment to local beneficiation is demonstrated in the role it has played in facilitating the development of the Heraeus refinery in Port Elizabeth with the DMR and Mintek.
As part of this process, a percentage of Northam’s metal is made available for local downstream beneficiation initiatives. Both Northam and Heraeus have articulated a commitment to building local intellectual capital and to this end discussions have been initiated with a number of scientific, research and educational institutions.
Global platinum producers 2009
(%)
Sources of platinum demand 2009 (%)
Global palladium producers 2009 (%)
Sources of palladium demand 2009 (%)
Basket price vs rand dollar exchange rate F2010
PGM sales by Northam (oz)
Cash operating costs (R/kg)
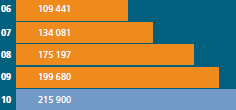
Precious metals in concentrate produced by Northam (oz)
NORTHAM SUSTAINABLE DEVELOPMENT REPORT 2010